How to add a pivot table in ExcelJS
There is no addPivotTable in any version you can install. Here is why,
and how to get a real one into the file anyway.
Short answer. ExcelJS has no pivot table API in any released version. The
implementation was merged into its master branch on 31 October 2023 — twelve days after the last
release — and has never been published, so npm install exceljs cannot produce one.
Write the workbook as usual, then pass the buffer through addPivotTable.
A pivot table from a sheet of data
const ExcelJS = require('exceljs')
const { addPivotTable } = require('chartsheet')
const fs = require('fs')

async function main () {
  const wb = new ExcelJS.Workbook()
  const data = wb.addWorksheet('Data')
  data.addRow(['Region', 'Product', 'Sales'])
  data.addRow(['East', 'Alpha', 100])
  data.addRow(['East', 'Beta', 150])
  data.addRow(['West', 'Alpha', 200])
  data.addRow(['West', 'Beta', 120])
  data.getRow(1).font = { bold: true }

  // the pivot needs a sheet of its own to land on
  wb.addWorksheet('Report')

  let buffer = await wb.xlsx.writeBuffer()

  buffer = await addPivotTable(buffer, {
    sourceSheet: 'Data',
    sourceRef: 'A1:C5',        // include the header row
    targetSheet: 'Report',
    anchor: 'A3',
    rows: ['Region'],
    columns: ['Product'],
    values: [{ field: 'Sales', fn: 'sum' }],
  })

  fs.writeFileSync('report.xlsx', buffer)
}

main()
Open report.xlsx and the Report sheet holds a working pivot table: sums by region
down the side, products across the top, grand totals on both. Click it and the field list appears,
same as one built by hand.
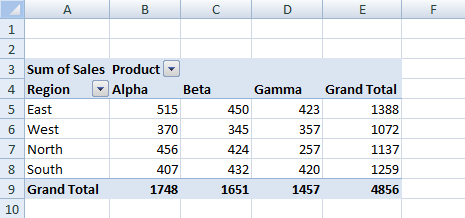
addPivotTable, open in Excel. Note the field
buttons on Region and Product — those only appear on a real pivot table. Excel computed every
one of those totals itself from the cache.Options
| Option | Meaning |
|---|---|
sourceSheet | Sheet holding the source table. Defaults to the first sheet |
sourceRef | The range, including the header row — 'A1:C500' |
targetSheet | Sheet the table is written to. Must already exist |
anchor | Top-left cell. Default 'A3' |
rows, columns, filters | Field names, taken from the header row |
values | ['Sales'], or [{ field, fn, name }] |
name | Table name. Default 'PivotTable1' |
fn is one of sum, count, average,
max, min, product, countNums,
stdDev, stdDevp, var, varp.
Several tables at once
const { addPivotTables } = require('chartsheet')

buffer = await addPivotTables(buffer, [
  { sourceSheet: 'Data', sourceRef: 'A1:D500', targetSheet: 'Report', anchor: 'A3',
    rows: ['Region'], columns: ['Product'], values: [{ field: 'Sales', fn: 'sum' }] },
  { sourceSheet: 'Data', sourceRef: 'A1:D500', targetSheet: 'Report', anchor: 'A20',
    name: 'PivotTable2',
    rows: ['Quarter'], values: [{ field: 'Sales', fn: 'average' }] },
])
Keeping a pivot table you already have
The opposite problem, and the older one. Load a workbook that already has a pivot table, edit a cell, write it back, and the pivot is gone — reported in 2017 and still open. ExcelJS models no pivot part, so it keeps only what it recognises and writes a file that never had one. Nothing is corrupt, which is why there is no error.
const { preservePivotTables } = require('chartsheet')

const original = fs.readFileSync('report.xlsx')     // has a pivot table

const wb = new ExcelJS.Workbook()
await wb.xlsx.load(original)
wb.getWorksheet('Data').getCell('C2').value = 999
const rewritten = await wb.xlsx.writeBuffer()       // pivot is gone here

const output = await preservePivotTables(original, rewritten)
You do not need to know how the pivot was laid out — the parts come off the original as they
are. The restored cache is marked refreshOnLoad, so Excel recomputes the totals from
the sheet as it opens, rather than showing the figures captured before your edit.
Charts go the same way on a read-write cycle, and most real templates have both:
const { preserveAll } = require('chartsheet')
const output = await preserveAll(original, rewritten)
If you would rather write the parts yourself
A pivot table is four things in the package, and each one is a silent failure if you get it wrong — Excel says only “we found a problem with some content”.
xl/pivotCache/pivotCacheDefinition1.xml— the source range and onecacheFieldper column, each listing its distinct values assharedItems.xl/pivotCache/pivotCacheRecords1.xml— one<r>per data row, referring to shared items by index rather than repeating values. TherecordCounton the definition must match the number of records here, or the totals come out wrong with no warning at all.xl/pivotTables/pivotTable1.xml— the layout, plus its own relationship to the cache definition. ThecacheIdalone is not enough; without that relationship Excel reports a problem with the content.<pivotCaches>inxl/workbook.xml, binding thecacheIdto the cache definition. It sits late in the workbook element order and must come beforeextLst.
All four new parts also need their own <Override> entries in
[Content_Types].xml. The generic <Default Extension="xml"> looks
like it should cover them and does not.
One thing worth knowing before you start: you do not have to compute the aggregation. Setting
refreshOnLoad="1" on the cache definition makes Excel rebuild rows, columns and totals
from the cached records when the file opens. Reimplementing Excel's own aggregation in JavaScript
is a great deal of work to arrive at the same numbers.
Checking the file
const { validate } = require('chartsheet')

const result = await validate(fs.readFileSync('report.xlsx'))
console.log(result.valid, result.errors)
This reports the specific defect instead of Excel's one unhelpful sentence — an unbound
cacheId, a missing cache relationship, a recordCount that disagrees with
the records. It works on any .xlsx, not only files this library produced.
Using SheetJS instead?
It works the same way, and SheetJS has the same gap. Adding a pivot table with SheetJS.
Questions
Why is there no addPivotTable in ExcelJS?
Because the code that adds it was never released. ExcelJS 4.4.0 was published on 19 October 2023; the pivot table commit landed on 31 October 2023. npm gives you the release, and the release has no pivot support.
Is it a real pivot table?
Yes — a native table with a pivot cache. Change the fields, expand and collapse, refresh it. Not a static block of cells formatted to look like one.
Does it work with SheetJS?
Yes. The parts are written into a finished .xlsx buffer, so anything producing
valid xlsx output works.
My pivot table disappears when ExcelJS saves the file. Why?
Because ExcelJS never wrote it. It models no pivot part, so a load-edit-save cycle drops the
pivot tables, their caches and the workbook's <pivotCaches> entry, with no
error. preservePivotTables lifts them off the original and puts them back.
Can I have a chart and a pivot table in the same workbook?
Yes. Pass the buffer through both — charts and pivot tables are separate parts and do not collide.